
Why the calls you are not looking at sometimes matter the most
What is survivorship bias
Survivorship bias is the error of drawing conclusions from the things that made it through a selection process while ignoring the things that did not. You study the winners because they are the ones in front of you, and you forget that the losers were filtered out before you ever saw the data.
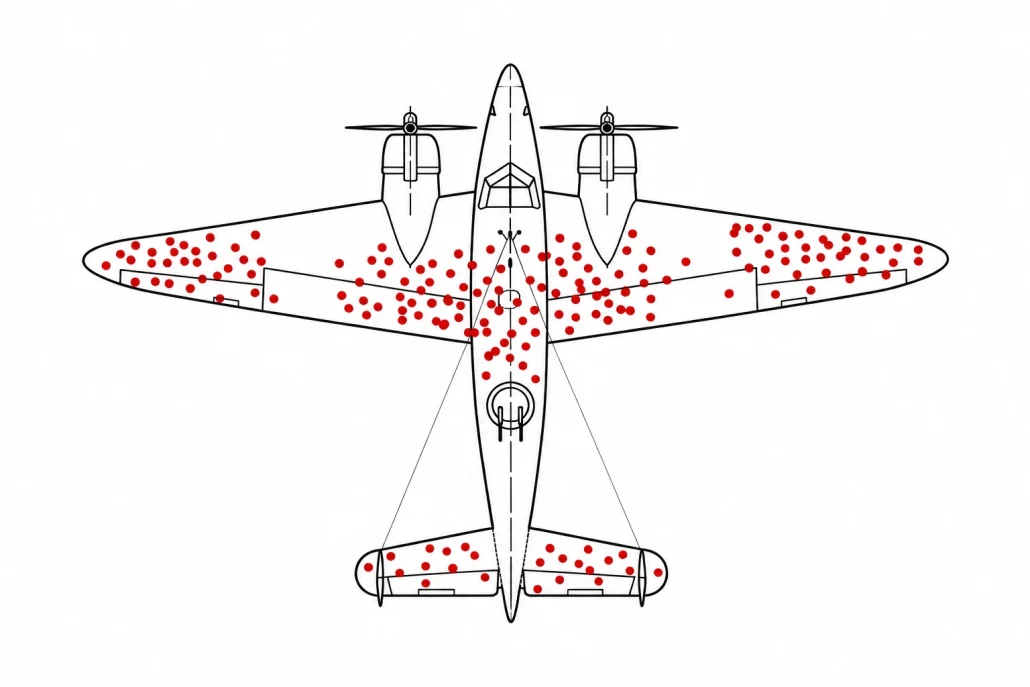
The classic example comes from World War II. Allied engineers wanted to add armor to bombers to improve their odds of returning from missions. They asked the statistical research group at Columbia University to analyze the damage to planes in order to identify where reinforcements could be added. A map of the bullet holes on the plane looked like this.
The statistician Abraham Wald pointed out the flaw. Those holes marked the places a plane could be hit and still fly home. The planes hit in the engines and the cockpit were not in the hangar to be studied, because they never made it back. The right move was to armor the areas with no holes, as those were the critical areas where damage resulted in complete failure. The data was censored by survival, and reading it at face value pointed in exactly the wrong direction.
How it shows up in the contact center
Swap the bombers for phone calls and the same trap shows up in more than one place.
Take a voice bot. A team reviewing how it performs usually starts with the calls that are easy to pull: the ones that connected, ran long enough to transcribe cleanly, and show a real back and forth. Those calls tend to look fine. The bot greets the caller, asks questions, gets answers, moves through its flow. But those are the calls that came back. The ones that hung up in the first fifteen seconds, dropped before connecting, or bailed to a human immediately did not survive the filter, and they are exactly where the failures live. Judging a bot by its clean transcripts is like armoring the wings.
Manual QA has the same blind spot. Most teams score a couple of calls per agent, and to make the scoring worthwhile they reach for calls with substance: a couple of minutes long, or tagged with a disposition that matters. The thirty-second calls, the quick hang-ups, and the odd dispositions rarely get pulled. So an agent’s score describes their tidy calls, and if something is going wrong in the other stuff, QA is not set up to see it.
What the full sample showed
We ran into the bot version of this recently. The team believed their bot was performing well, and the number they watched backed that up: containment sat around 75 percent. The catch was the definition. They counted any call that was not transferred to a live agent as contained, which treats a call that quietly died in the flow the same as one the bot actually resolved.
Splitting the full sample by what actually happened looked like this:
- True containment, where the bot resolved the call on its own: about 25 percent, and this may shift as the analysis closes out
- Transferred to a live agent: 25 percent
- No agent available to take the transfer, outside business hours: 5 percent
- No resolution reached in the flow: 45 percent, a mix of customer issues, such as a caller who never gave a usable reference number, and bot issues, such as a broken API or a dead step
True containment was closer to 25 percent than 75. That 45 percent in the middle was the survivor problem in metric form: the calls were not transferred, so the old measure scored them as wins, while the caller left with nothing resolved. Looking at every call rather than a filtered slice is also the main argument for automated QA across every interaction.
Why it was happening
Once we could see the whole population, the reasons were sorted into three kinds. Some were capability gaps: the bot hit tasks it could not complete and had no option but to transfer, which is a product problem, not a wording one. Others were messaging problems: the flow was sound but a prompt confused the caller or set the wrong expectation, where a clearer message would have moved the call forward. The rest were broken flows: dead ends, loops, and misroutes, including the unsolicited transfers to an agent the bot never needed to involve. Many of these issues were missed by the client because they weren’t looking at those contacts.
What changed
We handed the findings back broken out by call type and failure reason, so every issue pointed to a specific owner and fix: capability gaps to the product roadmap, messaging problems to prompt rewrites, broken flows to routing changes. Once those changes land, the uplift shows up directly in containment.
How to avoid it in your own analysis
You do not need a full study to protect yourself from this – you just need to interrogate your data before you trust it. Before drawing any conclusion about bot or agent performance, ask:
- Is this a comprehensive look at the customer journey, or a slice of it?
Am I only seeing a subset because of a filter I did not set on purpose, such as calls over a minute or only calls that are connected? - If I am sampling calls for QA, do they represent the agent’s full range, or only the tidy ones with a clean disposition?
- What happened to the calls that never connected, the ones under a minute, and the ones that ran over an hour?
If you cannot answer those, you are probably looking at survivors. The numbers can look great and still describe the wrong population. If you do rely on samples, our guide to representative call sampling covers sampling strategies and what a sample cannot show.
Talk to us
If you want help pressure-testing your data, sizing the calls you are missing, or setting up ongoing analysis so blind spots surface before they become surprises, our analytics team can help. Reach out to start a conversation today.